Java 程序诊断
{Back to Index}
1 jps
列出所有 Java 进程。
-l显示完整路径-m显示进程的参数-v显示通过命令传递给虚拟机的参数-V显示通过-XX:Flags=<filename>传递给虚拟机的参数
root@dashboard:~# jps -lmvV
10219 /usr/lib/dashboard/lib/application-2.2.0-SNAPSHOT.jar -Xmx1400m -Xms1400m -Djava.awt.headless=true -Dfile.encoding=UTF-8 -DPLATFORM_OS=linux
18604 sun.tools.jps.Jps -mlv -Dapplication.home=/usr/lib/jvm/java-8-openjdk-amd64 -Xms8m
2 jinfo
该命令可以很方便的查找 JVM 参数的当前值。
-flag <name>打印 JVM 参数值-flag [+|-]<name>设置 JVM 参数的布尔值-flag <name>=<value>设置 JVM 参数的值-sysprops打印 system properties
# jinfo -flag MaxTenuringThreshold 30204
-XX:MaxTenuringThreshold=15
3 jstat
用于查看各种 堆信息 。
Usage: jstat -help|-options -> 查看所有支持的选项
       jstat -<option> [-t] [-h<lines>] <vmid> [<interval> [<count>]]
                         |    |
                         |    |
                         |    |-> 周期性输出数据时,多少行后输出一个表头信息
                         |
                         |-> 输出信息中带上运行时间

# jstat -options
-class
-compiler
-gc
-gccapacity
-gccause
-gcmetacapacity
-gcnew
-gcnewcapacity
-gcold
-gcoldcapacity
-gcutil
-printcompilation
3.1 类加载信息
# jstat -class -t 10219 | column -t

           |-> 载入类的数量
           |
           |       |-> 载入类合计大小
           |       |
           |       |         |-> 卸载类数量
           |       |         |                |-> 用于加载和卸载类上所花的时间
           |       |         |                |
Timestamp  Loaded  Bytes     Unloaded  Bytes  Time
172402.1   128026  219580.1  6         5.3    196.12
3.2 JIT 编译信息
# jstat -compiler -t 10219 | column -t

           |-> 编译次数
           |
           |         |-> 编译失败次数
           |         |
           |         |       |-> 编译不可用次数
           |         |       |
           |         |       |        |-> 用于编译的时间
           |         |       |        |                   |-> 最后一次编译失败的类名和方法名
           |         |       |        |                   |
Timestamp  Compiled  Failed  Invalid  Time    FailedType  FailedMethod
172990.9   74344     6       0        345.89  1           org/springframework/cglib/core/MethodWrapper$MethodWrapperKey$$KeyFactoryByCGLIB$$552be97a  hashCode
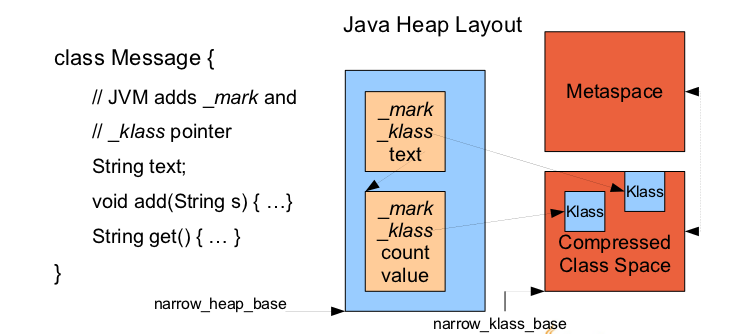
3.3 堆使用信息
# jstat -gc -t 10219 | column -t
           |-> Current survivor space 0 capacity (KB)
           |       |-> Current survivor space 1 capacity (KB)
           |       |       |-> Survivor space 0 utilization (KB)
           |       |       |    |-> Survivor space 1 utilization (KB)
           |       |       |    |       |-> Current eden space capacity (KB)
           |       |       |    |       |         |-> Eden space utilization (KB)
           |       |       |    |       |         |         |-> Current old space capacity (KB)
           |       |       |    |       |         |         |         |-> Old space utilization (KB)
           |       |       |    |       |         |         |         |         |-> Metaspace capacity (kB)
           |       |       |    |       |         |         |         |         |         |-> Metacspace utilization (kB)
           |       |       |    |       |         |         |         |         |         |         |-> Compressed class space capacity (kB)
           |       |       |    |       |         |         |         |         |         |         |        |-> Compressed class space used (kB)
           |       |       |    |       |         |         |         |         |         |         |        |        |-> Number of young generation garbage collection events
           |       |       |    |       |         |         |         |         |         |         |        |        |    |-> Young generation garbage collection time
           |       |       |    |       |         |         |         |         |         |         |        |        |    |      |-> Number of full GC events
           |       |       |    |       |         |         |         |         |         |         |        |        |    |      |    |-> Full garbage collection time
           |       |       |    |       |         |         |         |         |         |         |        |        |    |      |    |      |-> Total garbage collection time
Timestamp  S0C     S1C     S0U  S1U     EC        EU        OC        OU        MC        MU        CCSC     CCSU     YGC  YGCT   FGC  FGCT   GCT
173346.3   7680.0  8192.0  0.0  4480.0  461312.0  454956.6  955904.0  493714.5  654784.0  614956.7  87040.0  80940.2  191  9.303  7    2.929  12.232
3.4 百分比形式显示堆使用信息
# jstat -gcutil 10219 | column -t

|- Survivor space 0 utilization as a percentage of the space's current capacity
|      |- Survivor space 1 utilization as a percentage of the space's current capacity
|      |     |- Eden space utilization as a percentage of the space's current capacity
|      |     |      |- Old space utilization as a percentage of the space's current capacity
|      |     |      |      |- Metaspace utilization as a percentage of the space's current capacity
|      |     |      |      |      |- Compressed class space utilization as a percentage
S0     S1    E      O      M      CCS    YGC  YGCT   FGC  FGCT   GCT
58.33  0.00  89.54  51.65  93.92  92.99  192  9.350  7    2.929  12.279
3.5 各个代的内存配置
显示各个代内存配置的最大最小值,和当前值。
# jstat -gccapacity 10219 | column -t

|- Minimum new generation capacity (kB)
|         |- Maximum new generation capacity (kB)
|         |         |- Current new generation capacity (kB)
|         |         |                                   |- Minimum old generation capacity (kB)
|         |         |                                   |         |- Maximum old generation capacity (kB)
|         |         |                                   |         |         |- Current old generation capacity (kB)
|         |         |                                   |         |         |                   |- Minimum metaspace capacity (kB)
|         |         |                                   |         |         |                   |     |- Maximum metaspace capacity (kB)
|         |         |                                   |         |         |                   |     |                    |- Compressed class space minimum capacity (kB)
|         |         |                                   |         |         |                   |     |                    |      |- Compressed class space maximum capacity (kB)
|         |         |                                   |         |         |                   |     |                    |      |
NGCMN     NGCMX     NGC       S0C     S1C     EC        OGCMN     OGCMX     OGC       OC        MCMN  MCMX       MC        CCSMN  CCSMX      CCSC     YGC  FGC
477696.0  477696.0  477696.0  7680.0  7680.0  462336.0  955904.0  955904.0  955904.0  955904.0  0.0   1617920.0  654784.0  0.0    1048576.0  87040.0  192  7
3.6 新生代信息
# jstat -gcnew 10219 | column -t

                             |- Tenuring threshold (新生代晋升到老年代所需的年龄)
                             |   |- Maximum tenuring threshold
                             |   |    |- Desired survivor size (kB)
S0C     S1C     S0U     S1U  TT  MTT  DSS     EC        EU        YGC  YGCT
7680.0  7680.0  4480.0  0.0  15  15   7680.0  462336.0  460181.9  192  9.350
3.6.1 新生代各个区(space)内存最大最小值
# jstat -gcnewcapacity 10219 | column -t

                              |- Maximum survivor space 0 capacity (kB)
                              |                 |- Maximum survivor space 1 capacity (kB)
                              |                 |                 |- Maximum eden space capacity (kB)
NGCMN     NGCMX     NGC       S0CMX     S0C     S1CMX     S1C     ECMX      EC        YGC  FGC
477696.0  477696.0  477696.0  159232.0  7168.0  159232.0  7680.0  476672.0  462336.0  193  7
3.7 老年代信息
# jstat -gcold 10219 | column -t
MC        MU        CCSC     CCSU     OC        OU        YGC  FGC  FGCT   GCT
654784.0  614992.2  87040.0  80940.2  955904.0  493746.5  193  7    2.929  12.322
3.7.1 老年代内存最大最小值 1
# jstat -gcoldcapacity 10219 | column -t
OGCMN     OGCMX     OGC       OC        YGC  FGC  FGCT   GCT
955904.0  955904.0  955904.0  955904.0  193  7    2.929  12.322
3.8 元空间信息
# jstat -gcmetacapacity 10219 | column -t
MCMN  MCMX       MC        CCSMN  CCSMX      CCSC     YGC  FGC  FGCT   GCT
0.0   1617920.0  654784.0  0.0    1048576.0  87040.0  193  7    2.929  12.322
3.9 GC 原因
和 -gcutil 显示相同的内容,但多了 GC 的原因。
原因的解释参见:Java GC Causes Distilled
# jstat -gccause 10219 | column -t
                                                                         |- 上一次 GC 的原因
                                                                         |                    |- 当前正在 GC 的原因
                                                                         |                    |
S0     S1    E      O      M      CCS    YGC  YGCT   FGC  FGCT   GCT     LGCC                 GCC
58.33  0.00  80.61  51.65  93.92  92.99  192  9.350  7    2.929  12.279  Allocation  Failure  No  GC -> 当前时刻未进行 GC
4 jcmd
jcmd 针对 JVM 执行一条命令,可以用来导出堆,导出线程信息,执行 GC 等。
jcmd 可以直接使用 MainClass 的名字来代替进程号 ,便于脚本编写。
4.1 查看所有支持的命令
# jcmd application-2.2.0-SNAPSHOT.jar help
30204:
The following commands are available:
VM.native_memory
ManagementAgent.stop
ManagementAgent.start_local
ManagementAgent.start
VM.classloader_stats
GC.rotate_log
Thread.print
GC.class_stats
GC.class_histogram
GC.heap_dump
GC.finalizer_info
GC.heap_info
GC.run_finalization
GC.run
VM.uptime
VM.dynlibs
VM.flags
VM.system_properties
VM.command_line
VM.version
help

For more information about a specific command use 'help <command>'. --> 查看具体某个命令的使用说明
4.2 线程信息
# jcmd application-2.2.0-SNAPSHOT.jar Thread.print -l=true | head -30
30204:
2020-04-05 21:12:54
Full thread dump OpenJDK 64-Bit Server VM (25.242-b08 mixed mode):

"ForkJoinPool-14-worker-1" #1116 daemon prio=5 os_prio=0 tid=0x00007f5139380000 nid=0x38f1 waiting on condition [0x00007f50d9aef000]
   java.lang.Thread.State: WAITING (parking)
        at sun.misc.Unsafe.park(Native Method)
        - parking to wait for  <0x00000000c0a84bc8> (a java.util.concurrent.ForkJoinPool)
        at java.util.concurrent.ForkJoinPool.awaitWork(ForkJoinPool.java:1824)
        at java.util.concurrent.ForkJoinPool.runWorker(ForkJoinPool.java:1693)
        at java.util.concurrent.ForkJoinWorkerThread.run(ForkJoinWorkerThread.java:157)

   Locked ownable synchronizers:
        - None

"ForkJoinPool-14-worker-0" #1115 daemon prio=5 os_prio=0 tid=0x00007f516889d800 nid=0x38f0 waiting on condition [0x00007f50e85e8000]
   java.lang.Thread.State: WAITING (parking)
        at sun.misc.Unsafe.park(Native Method)
        - parking to wait for  <0x00000000c0a84bc8> (a java.util.concurrent.ForkJoinPool)
        at java.util.concurrent.ForkJoinPool.awaitWork(ForkJoinPool.java:1824)
        at java.util.concurrent.ForkJoinPool.runWorker(ForkJoinPool.java:1693)
        at java.util.concurrent.ForkJoinWorkerThread.run(ForkJoinWorkerThread.java:157)

   Locked ownable synchronizers:
        - None

"ForkJoinPool-14-worker-7" #1114 daemon prio=5 os_prio=0 tid=0x00007f51500d2000 nid=0x38ef waiting on condition [0x00007f50d41d6000]
   java.lang.Thread.State: WAITING (parking)
        at sun.misc.Unsafe.park(Native Method)
        - parking to wait for  <0x00000000c0a84bc8> (a java.util.concurrent.ForkJoinPool)
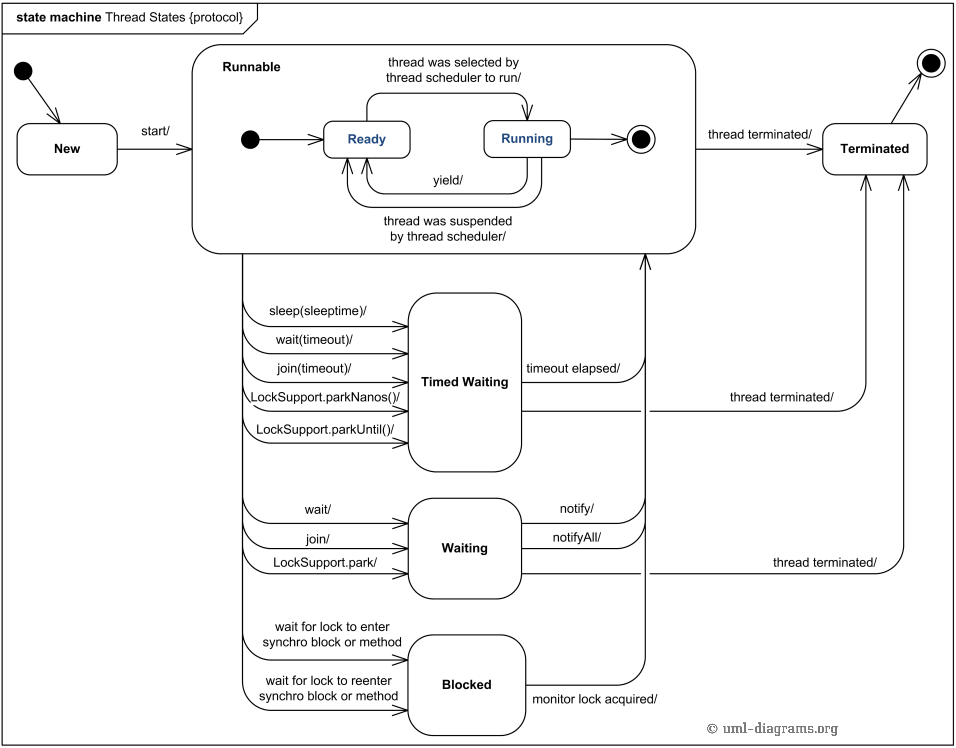
4.2.2 VisualVM 中线程状态 6
Running
对应线程状态中的 RUNNABLE 。
Sleeping
线程中正在运行
Thread.sleep()。Wait
对应线程状态中的 WAITING 和 TIMED_WAITING 。
Park
线程中调用
LockSupport.park()。Monitor
对应线程状态中的 BLOCKED 。
4.3 类统计信息
# jcmd application-2.2.0-SNAPSHOT.jar GC.class_histogram | head
30204:

 num     #instances         #bytes  class name
----------------------------------------------
   1:        943462      108025952  [C
   2:         63203       27467400  [B
   3:        706339       22602848  java.util.concurrent.ConcurrentHashMap$Node
   4:        939886       22557264  java.lang.String
   5:        241964       21292832  java.lang.reflect.Method
   6:        141435       15452584  java.lang.Class
4.4 创建堆转储
jcmd <pid> GC.heap_dump filename=Myheapdump
4.5 堆使用情况
# jcmd application-2.2.0-SNAPSHOT.jar GC.heap_info
30204:
 PSYoungGen      total 355840K, used 173437K [0x00000000e2d80000, 0x0000000100000000, 0x0000000100000000)
  eden space 237056K, 49% used [0x00000000e2d80000,0x00000000e9f53c10,0x00000000f1500000)
  from space 118784K, 47% used [0x00000000f1500000,0x00000000f4c8bb90,0x00000000f8900000)
  to   space 114176K, 0% used [0x00000000f9080000,0x00000000f9080000,0x0000000100000000)
 ParOldGen       total 955904K, used 692249K [0x00000000a8800000, 0x00000000e2d80000, 0x00000000e2d80000)
  object space 955904K, 72% used [0x00000000a8800000,0x00000000d2c06538,0x00000000e2d80000)
 Metaspace       used 680186K, capacity 762632K, committed 766784K, reserved 1714176K
  class space    used 89380K, capacity 101366K, committed 102720K, reserved 1048576K
4.6 直接内存使用情况
需在启动参数中加入 -XX:NativeMemoryTracking=summary 或者 -XX:NativeMemoryTracking=detail 开启跟踪。
$ jcmd 96538 help VM.native_memory
96538:
VM.native_memory
Print native memory usage

Impact: Medium

Permission: java.lang.management.ManagementPermission(monitor)

Syntax : VM.native_memory [options]

Options: (options must be specified using the <key> or <key>=<value> syntax)
        summary : [optional] request runtime to report current memory summary, which includes total reserved and committed memory, along with memory usage summary by each subsytem. (BOOLEAN, false)
        detail : [optional] request runtime to report memory allocation >= 1K by each callsite. (BOOLEAN, false)
        baseline : [optional] request runtime to baseline current memory usage, so it can be compared against in later time. (BOOLEAN, false)
        summary.diff : [optional] request runtime to report memory summary comparison against previous baseline. (BOOLEAN, false)
        detail.diff : [optional] request runtime to report memory detail comparison against previous baseline, which shows the memory allocation activities at different callsites. (BOOLEAN, false)
        shutdown : [optional] request runtime to shutdown itself and free the memory used by runtime. (BOOLEAN, false)
        statistics : [optional] print tracker statistics for tuning purpose. (BOOLEAN, false)
        scale : [optional] Memory usage in which scale, KB, MB or GB (STRING, KB)
4.6.1 设置基线
jcmd <pid> VM.native_memory baseline
4.6.2 查看 diff
$ jcmd 81231 VM.native_memory summary.diff
81231:

Native Memory Tracking:

Total: reserved=7070801KB +1157182KB, committed=1832717KB +1157314KB

-                 Java Heap (reserved=4194304KB, committed=262144KB)
                            (mmap: reserved=4194304KB, committed=262144KB)

-                     Class (reserved=1070344KB +1KB, committed=23304KB +1KB)
                            (classes #1982 +3)
                            (malloc=11528KB +1KB #1658 +31)
                            (mmap: reserved=1058816KB, committed=11776KB)

-                    Thread (reserved=27762KB, committed=27762KB)
                            (thread #28)
                            (stack: reserved=27648KB, committed=27648KB)
                            (malloc=82KB #147)
                            (arena=32KB #50)

-                      Code (reserved=250115KB +29KB, committed=4027KB +161KB)
                            (malloc=515KB +29KB #1319 +65)
                            (mmap: reserved=249600KB, committed=3512KB +132KB)

-                        GC (reserved=165934KB, committed=153138KB)
                            (malloc=12690KB #160)
                            (mmap: reserved=153244KB, committed=140448KB)

-                  Compiler (reserved=148KB, committed=148KB)
                            (malloc=18KB #69 +1)
                            (arena=131KB #7)

-                  Internal (reserved=1358382KB +1157120KB, committed=1358382KB +1157120KB)
                                                 ---------
                                                     |-> 直接内存基于基线的变化
                            (malloc=1358350KB +1157120KB #3798 +229)
                            (mmap: reserved=32KB, committed=32KB)

-                    Symbol (reserved=3251KB +2KB, committed=3251KB +2KB)
                            (malloc=1932KB +2KB #6045 +40)
                            (arena=1319KB #1)

-    Native Memory Tracking (reserved=366KB +30KB, committed=366KB +30KB)
                            (malloc=129KB +20KB #1823 +275)
                            (tracking overhead=236KB +10KB)

-               Arena Chunk (reserved=196KB, committed=196KB)
                            (malloc=196KB)
$ jcmd 81231 VM.native_memory detail.diff
...

[0x000000011019ab18] _ZN8CodeBlob12set_oop_mapsEP9OopMapSet+0x80
[0x000000011019ac53] _ZN8CodeBlobC2EPKcP10CodeBufferiiiiP9OopMapSet+0xa9
[0x0000000110471202] _ZN7nmethodC2EP6MethodiiiP11CodeOffsetsiP24DebugInformationRecorderP12DependenciesP10CodeBufferiP9OopMapSetP21ExceptionHandlerTabl
eP22ImplicitExceptionTableP16AbstractCompileri+0x4e
[0x0000000110471e51] _ZN7nmethod11new_nmethodE12methodHandleiiP11CodeOffsetsiP24DebugInformationRecorderP12DependenciesP10CodeBufferiP9OopMapSetP21Exce
ptionHandlerTableP22ImplicitExceptionTableP16AbstractCompileri+0x1ef
                             (malloc=463KB type=Code +26KB #831 +46)

[0x000000011043a71b] _ZNK14LinkedListImplI20ReservedMemoryRegionLN11ResourceObj15allocation_typeE2EL10MemoryType10ELN17AllocFailStrategy13AllocFailEnum
E1EE8new_nodeERKS0_+0x25
[0x00000001104390b6] _ZN14LinkedListImplI20ReservedMemoryRegionLN11ResourceObj15allocation_typeE2EL10MemoryType10ELN17AllocFailStrategy13AllocFailEnumE
1EE3addERKS0_+0x12
[0x0000000110439591] _ZN29VirtualMemoryAllocationWalker18do_allocation_siteEPK20ReservedMemoryRegion+0x23
[0x00000001105b2253] _ZN20VirtualMemoryTracker19walk_virtual_memoryEP19VirtualMemoryWalker+0x57
                             (malloc=4KB type=Native Memory Tracking +4KB #39 +39)

[0x0000000110428e2c] _ZN15MallocSiteTable9new_entryERK15NativeCallStack10MemoryType+0x0
[0x0000000110428e98] _ZN15MallocSiteTable13lookup_or_addERK15NativeCallStackPmS3_10MemoryType+0x0
[0x00000001104291b0] _ZN15MallocSiteTable13allocation_atERK15NativeCallStackmPmS3_10MemoryType+0x0
                             (malloc=107KB type=Native Memory Tracking +2KB #1515 +28)

[0x0000000110539232] _ZN6SymbolnwEmiP6Thread+0x90
[0x000000011053a870] _ZN11SymbolTable15allocate_symbolEPKhibP6Thread+0x72
[0x000000011053a9c6] _ZN11SymbolTable9basic_addEP15ClassLoaderData18constantPoolHandleiPPKcPiS6_PjP6Thread+0x12e
[0x000000011053acbf] _ZN11SymbolTable3addEP15ClassLoaderData18constantPoolHandleiPPKcPiS6_PjP6Thread+0xcb
                             (malloc=232KB type=Symbol +2KB #5303 +40)

...
4.7 查看 finalizer 队列
不恰当的 finalize() 函数可能导致待回收的对象堆积在 finalizer 队列中,可使用下面的命令检查该队列:
# jcmd application-2.2.0-SNAPSHOT.jar GC.finalizer_info
30204:
No instances waiting for finalization found
4.8 system properties
# jcmd application-2.2.0-SNAPSHOT.jar VM.system_properties | head
30204:
#Sun Apr 05 21:17:04 CST 2020
java.vendor=Private Build
sun.java.launcher=SUN_STANDARD
sun.management.compiler=HotSpot 64-Bit Tiered Compilers
sun.nio.ch.bugLevel=
catalina.useNaming=true
os.name=Linux
4.9 VM 启动选项
# jcmd nm-aio-application-2.2.0-SNAPSHOT.jar VM.flags
30204:
-XX:CICompilerCount=2 -XX:InitialHeapSize=1468006400 -XX:MaxHeapSize=1468006400 -XX:MaxNewSize=489160704 -XX:MinHeapDeltaBytes=524288 -XX:NewSize=489160704 -XX:OldSize=978845696 -XX:+UseCompressedClassPointers -XX:+UseCompressedOops -XX:+UseParallelGC
4.10 VM 启动参数
# jcmd application-2.2.0-SNAPSHOT.jar VM.command_line
30204:
VM Arguments:
jvm_args: -Xmx1400m -Xms1400m -Djava.awt.headless=true -Dfile.encoding=UTF-8 -DPLATFORM_OS=linux -DCERTS_DIR=/var/lib/dashboard/certs -DNM_LOGLINK=/usr/lib/dashboard/logs -DNM_DATALINK=/usr/lib/dashboard/data -DNM_ETCDIR=/etc/dashboard -DNM_BINDIR=/usr/lib/dashboard/bin -DNM_NGINXDIR=/usr/lib/dashboard/bin -DNM_TMPDIR=/tmp/dashboard -DNM_CACHEDIR=/var/cache/dashboard -DNGINX_CONF_DIR=/var/lib/dashboard/nginx -Dcatalina.home=/usr/lib/dashboard/tomcat -Dcatalina.base=/var/lib/dashboard/tomcat -DNM_CODEDIR=/usr/lib/dashboard -DMONGO_MAX_CACHE_MEM=.250 -DREDIS_MAX_MEM=120mb -DWAR_VERSION=2.2.0 -DDISABLE_NORTHBOUND=false -DCISCO_FINDIT_VM=true -Dspring.profiles.active=allinone,apidoc,allinone-linux -Djava.util.logging.config.file=/usr/lib/dashboard/data/tomcat/conf/logging.properties -Djava.util.logging.manager=org.apache.juli.ClassLoaderLogManager
java_command: /usr/lib/application-2.2.0-SNAPSHOT.jar
java_class_path (initial): /usr/lib/application-2.2.0-SNAPSHOT.jar
Launcher Type: SUN_STANDARD
4.11 运行时间
# jcmd nm-aio-application-2.2.0-SNAPSHOT.jar VM.uptime
30204:
2909.445 s
4.12 手动 GC
jcmd <pid> GC.run
4.13 类加载器信息
可以显示类加载的父子关系,内部加载的类的数量和总大小。
# jcmd application-2.2.0-SNAPSHOT.jar VM.classloader_stats | head
30204:
ClassLoader         Parent              CLD*               Classes   ChunkSz   BlockSz  Type
0x0000000103fc9c28  0x0000000103f39358  0x00007f511411e5a0       4     83968     29208  jdk.nashorn.internal.runtime.ScriptLoader
0x0000000103fc9c28  0x0000000103f39358  0x00007f511402c690       1      6144      2784  jdk.nashorn.internal.runtime.ScriptLoader
0x0000000103fc9c28  0x0000000103f39358  0x00007f511402c330       1      6144      2440  jdk.nashorn.internal.runtime.ScriptLoader
0x0000000103fc9c28  0x0000000103f39358  0x00007f511402bce0       1     10240      8008  jdk.nashorn.internal.runtime.ScriptLoader
0x0000000103fc9c28  0x0000000103f39358  0x00007f51141e0950       1     14336     12120  jdk.nashorn.internal.runtime.ScriptLoader
0x0000000103fc9c28  0x0000000103f39358  0x00007f511418b930      10     88064     36624  jdk.nashorn.internal.runtime.ScriptLoader
0x0000000103fc9c28  0x0000000103f39358  0x00007f511418c330       1      6144      3000  jdk.nashorn.internal.runtime.ScriptLoader
0x0000000103fc9c28  0x0000000103f39358  0x00007f511418c3a0       5     16384     11224  jdk.nashorn.internal.runtime.ScriptLoader
4.14 启用 JMX
# jcmd application-2.2.0-SNAPSHOT.jar ManagementAgent.start jmxremote.port=9999 jmxremote.ssl=false jmxremote.authenticate=false
30204:
Command executed successfully
连接远程的 JMX server 时,需要在远程服务器上做点手脚:7
- 方案一:修改
/etc/hosts文件,使得hostname -i的结果为服务器的可访问 IP (而不是 127.0.0.1 ),然后重启 java 进程 8 - 方案二:使用
-Djava.rmi.server.hostname=YOUR_IP重启进程 - 方案三:应用程序预留接口,动态修改
java.rmi.server.hostname系统属性为正确的 IP ,并重启 JMX Managerment Agent
4.14.1 jstatd
有时候使用 VisualVM Visual GC 插件监控远程 JVM 时,需要开启 jstatd 服务:
jstatd -p 1099 -J-Djava.security.policy=<(echo 'grant codebase "file:${java.home}/../lib/tools.jar" {permission java.security.AllPermission;};') -J-Djava.rmi.server.hostname=<ip>
4.15 性能统计
# jcmd application-2.2.0-SNAPSHOT.jar PerfCounter.print | grep thread
java.threads.daemon=114
java.threads.live=302
java.threads.livePeak=363
java.threads.started=1942
sun.ci.threads=2
sun.rt.threadInterruptSignaled=0
sun.threads.vmOperationTime=40800901989

# jcmd application-2.2.0-SNAPSHOT.jar PerfCounter.print | grep gc.generation
sun.gc.generation.0.capacity=489160704
sun.gc.generation.0.maxCapacity=489160704
sun.gc.generation.0.minCapacity=489160704
sun.gc.generation.0.name="new"
sun.gc.generation.0.space.0.capacity=270008320
sun.gc.generation.0.space.0.initCapacity=0
sun.gc.generation.0.space.0.maxCapacity=488112128
sun.gc.generation.0.space.0.name="eden"
sun.gc.generation.0.space.0.used=86324272
sun.gc.generation.0.space.1.capacity=108527616
sun.gc.generation.0.space.1.initCapacity=0
sun.gc.generation.0.space.1.maxCapacity=163053568
sun.gc.generation.0.space.1.name="s0"
sun.gc.generation.0.space.1.used=0
sun.gc.generation.0.space.2.capacity=109576192
sun.gc.generation.0.space.2.initCapacity=0
sun.gc.generation.0.space.2.maxCapacity=163053568
sun.gc.generation.0.space.2.name="s1"
sun.gc.generation.0.space.2.used=0
sun.gc.generation.0.spaces=3
sun.gc.generation.1.capacity=978845696
sun.gc.generation.1.maxCapacity=978845696
sun.gc.generation.1.minCapacity=978845696
sun.gc.generation.1.name="old"
sun.gc.generation.1.space.0.capacity=978845696
sun.gc.generation.1.space.0.initCapacity=978845696
sun.gc.generation.1.space.0.maxCapacity=978845696
sun.gc.generation.1.space.0.name="old"
sun.gc.generation.1.space.0.used=403958728
sun.gc.generation.1.spaces=1
5 BTrace
使用 BTrace 可以在不停机的情况下,将字节码注入 JVM ,并实施监控。

Figure 3: BTrace 工作原理
5.1 安装
在此处下载二进制包,解压到服务器上。(Java 8 请使用v1.3.11.3 )
设置好 JAVA_HOME , BTRACE_HOME 和路径:
export JAVA_HOME=/usr/lib/jvm/java-8-openjdk-amd64
export BTRACE_HOME=/home/test/btrace
export PATH=$PATH:$BTRACE_HOME/bin
直接运行 btrace <java-pid> <btrace_script.java> 即可。=
BTrace 的脚本容易写错,可以事先在 VisualVM 的 BTraceWorkbeanch 插件中调试确保无误后再在服务器中运行。
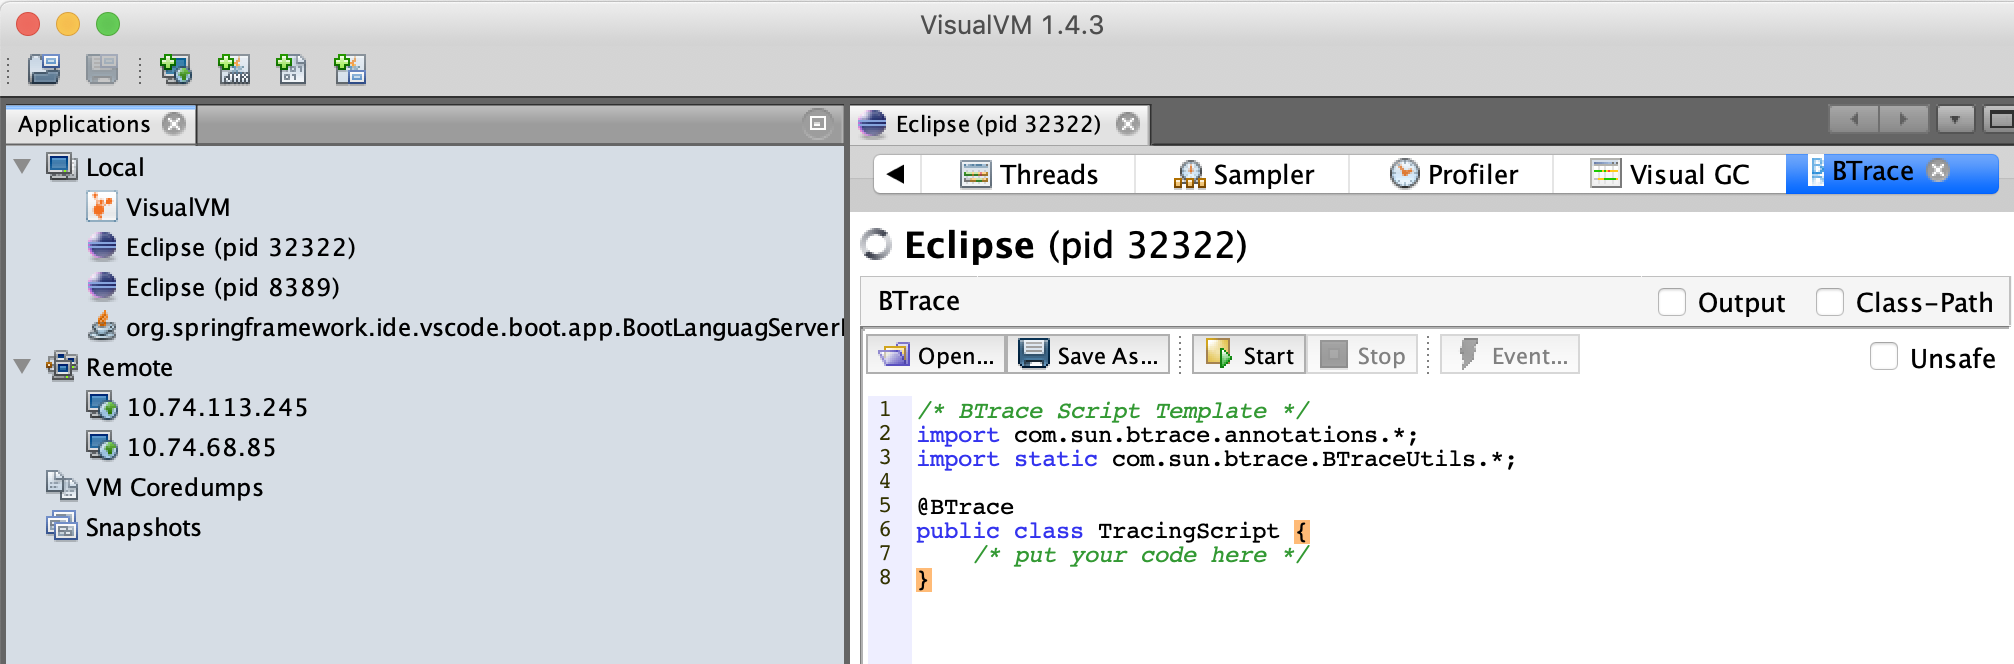
Figure 4: Btrace in VisualVM
5.2 脚本模板
import com.sun.btrace.annotations.*;
import static com.sun.btrace.BTraceUtils.*;

import com.sun.btrace.AnyType;
import com.sun.btrace.BTraceUtils.Reflective;
@BTrace
public class Helloworld {
    // Add @OnMethod here
}
5.3 常见使用场景
5.3.1 监控函数运行时间
@OnMethod(clazz = "com.hao.notes.jvm.BtraceExample", method = "timeConsumingTask",
          location = @Location(Kind.RETURN))
public static void traceMethodRunningTime(@Duration long duration) {
    println("=== " + timestamp("yyyy-MM-dd HH:mm:ss") + " ===");
    println(strcat("duration(ms): ", str(duration / 1000000)));
}
5.3.2 监控函数返回值
@OnMethod(clazz="com.hao.notes.jvm.BtraceExample", method="newStudent", location=@Location(Kind.RETURN))
public static void traceMetherReturnValue(@ProbeClassName String probeClass,
                                          @ProbeMethodName String probeMethod, @Return String result) {
    println("=== " + timestamp("yyyy-MM-dd HH:mm:ss") + "/" + probeClass + "/" + probeMethod + " ===");
    println(result);
}
5.3.3 使用正则表达式进行跟踪
@OnMethod(clazz="/com\\.hao\\.notes\\.jvm\\..*trace.*/", method="/.*/")
public static void traceByRegex(@ProbeClassName String pcn, @ProbeMethodName String pmn) {
    println("execute on " + pcn + "/" + pmn);
}
5.3.4 根据行号跟踪
@OnMethod(clazz="com.hao.notes.jvm.BtraceExample", location=@Location(value=Kind.LINE, line=-1)) // -1 表示所有行
public static void traceByLineNum(@ProbeClassName String probeClass,
                                  @ProbeMethodName String probeMethod, int line) {
    println("=== " + timestamp("yyyy-MM-dd HH:mm:ss") + " ===");
    println(probeClass + "."  + probeMethod);
    println("#" + line);
}
5.3.5 跟踪方法参数
@OnMethod(clazz="com.hao.notes.jvm.BtraceExample", method="newStudent")
public static void traceMethodArgs(@ProbeClassName String probeClass,
                                   @ProbeMethodName String probeMethod, AnyType[] args) {
    println("=== " + timestamp("yyyy-MM-dd HH:mm:ss") + " ===");
    printArray(args);
}
5.3.6 打印方法调用的线程
@OnMethod(clazz="com.hao.notes.jvm.BtraceExample", method="newStudent")
public static void traceMethodArgs(@ProbeClassName String probeClass,
                                   @ProbeMethodName String probeMethod, AnyType[] args) {
    println("=== " + timestamp("yyyy-MM-dd HH:mm:ss") + " ===");
    println(Threads.name(Threads.currentThread())); // 打印线程名字
}
5.3.7 周期性检查死锁
如果存在死锁,则打印。
@OnTimer(4000)
public static void checkDeadlock() {
    println("=== " + timestamp("yyyy-MM-dd HH:mm:ss") + " ===");
    deadlocks();
}
5.3.8 检查 this 对象属性
@OnMethod(clazz="com.hao.notes.jvm.Person", method="sayHello")
public static void onTriggered(@ProbeClassName String probeClass,
                               @ProbeMethodName String probeMethod, @Self Object me) {
    println("=== " + timestamp("yyyy-MM-dd HH:mm:ss") + " ===");
    printFields(me);
}
5.3.9 监控函数内调用其他函数的运行时间
@OnMethod(clazz="com.hao.notes.jvm.Person", method="sayHello",
          location=@Location(value=Kind.CALL, clazz="/.*/", method="/.*/", where=Where.AFTER))
public static void onTriggered(@Self Object self,
                               @TargetInstance Object instance,
                               @TargetMethodOrField(fqn=true) String method,
                               @Duration long duration) {
    println("=== " + timestamp("yyyy-MM-dd HH:mm:ss") + " ===");
    println(str(instance)); // 如果是静态方法,instance == null
    println(method + ": " + duration/1000000 + " ms");
}
6 内存溢出常见原因 9
6.1 Heap 溢出
当对象大小之和大于由 Xmx 参数指定的堆大小空间时,就会发生溢出。
6.2 直接内存溢出
堆内存 GC 的时候会主动释放垃圾直接内存,或者直接内存使用量达到 -XX:MaxDirecMemorySize 的设置值时也会触发释放。
如果系统的堆内存不及时 GC ,而直接内存又频繁申请,则比较容易发生直接内存溢出。
6.3 线程过多
每个线程的开启都要占用系统内存, 线程的栈空间是在堆外分配的, 当线程数量太大时,将导致 OOM 。
使用参数 -Xss 减少每个线程需要开辟的栈空间,可以增加系统能支撑的最大线程数,但是, 栈溢出的风险会变大。
6.4 元数据区溢出
如果系统不断产生新的类而没有回收,最终可能造成元数据区溢出。
6.5 GC 效率低下
根据 GC 占用的系统时间,以及释放内存的大小,JVM 会评估 GC 的效率,一旦 JVM 认为 GC 的效率过低,可能直接抛出 OOM 。
通常,JVM 会检查以下几种情况:
- 花在 GC 上的时间是否超过 98%
- 老年代释放的内存是否小于 2%
- eden 区释放的内存是否小于 2%
- 是否连续 5 次 GC 都出现上述的情况
当满足条件后,JVM 会抛出 GC overhead limit exceeded 字样。